: What It Is? Is PXMD A Buy? IPO Date, Price and Forecast (Why Should You Avoid It?)")


Ethereum price analysis gives us an image on Sunday, October 7th. Ethereum (ETH) showed a small increase of about 0.71% in the last 24 hours.
In the past 7 days, it has dropped by 2.85% and is currently trading at $ 224.71 at the time of writing.
Ethereum price last situation Sunday, October 7
The ETH / USD market is approaching to the tip of the rising triangle and the horizontal movement of the market continues. We’re approaching the moment the Ethereum holders are longing for. Because in this case, the market typically makes a big volume.
Although Ethereum (ETH) price declines by 52% in the last three months, ETH is currently ranked second with a market value of $ 23.01 billion.
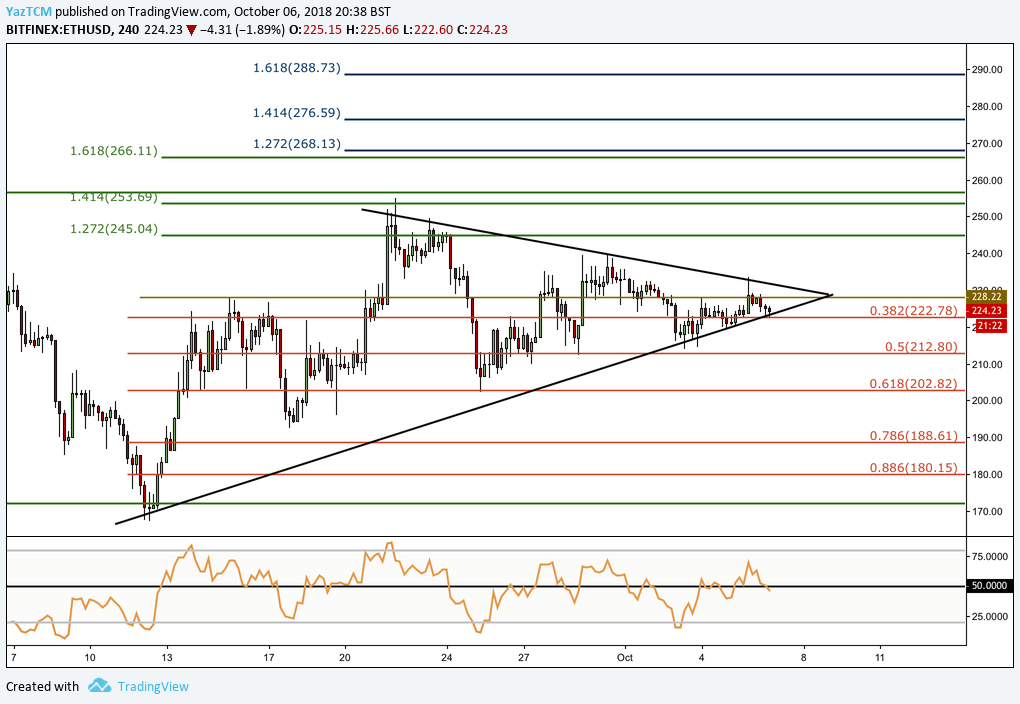
In the short-term daily chart presented above, we see that Ethereum continues its horizontal transactions in the consolidation phase. Currently supported at .382 Fibonacci Correction level and priced at $ 222.78.
Over the past two weeks, the market has started to form a rising wedge, and the price movement is rapidly approaching to the end of the consolidation phase. At this point, an upward refraction may have a domino effect when the Ethereum (ETH) once again goes over 300 dollars.
After such a break-up, we can see an important resistance in the medium term at the 1,414 Fibonacci Correction level (green) price range of $ 253.69. If bull momentum persists, support may be expected in a shorter term at 1.272 and 1.414 Fibonacci Correction levels (blue) at the price band of 268.13 and 276.59 dollars.
On the other hand, if the price movement is affected by the month and moves to the bottom of the triangle, the support level will be $ 202.82 at the Fibonacci Correction level.
If the bears continue to push the price down below $ 200, we can see support at .786 and .886 Fibonacci Correction levels. ETH prices are $ 188 and $ 180 respectively.
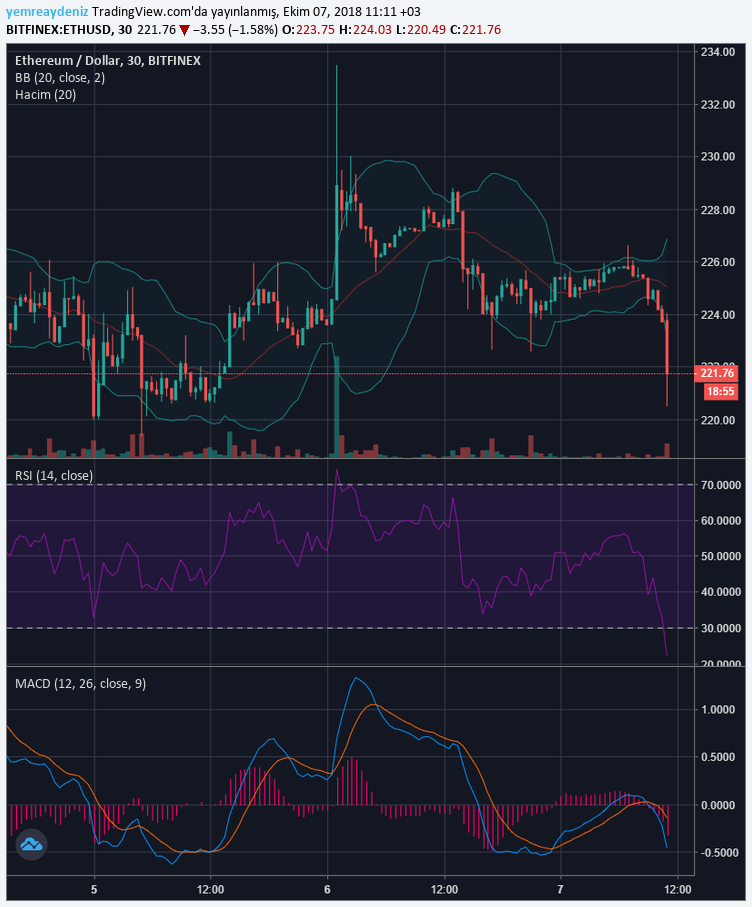
It is important to follow the RSI indicator on a daily chart for an important bull run. RSI is moving to 70 to oversold conditions. If the RSI can stay above 50 for a long time, this shows that bulls control the momentum in the market.
: What It Is? Is PXMD A Buy? IPO Date, Price and Forecast (Why Should You Avoid It?)")


 Price Predictions: Will 2019 Bring Redemption for VeChain?")
