

Table of Contents
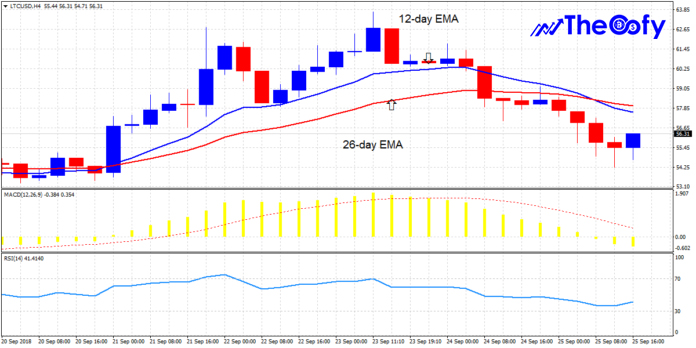
LTC/USD Medium-term: Bearish
Resistances: $62, $64, $66
Supports: $40, $38, $36
On September 24, the LTC trend was bearish. The digital asset tested the level of $60 as the upper limit of price range with a resistance. LTC had been range bound for a while now between these levels. The digital asset is range bound, so a drop to the level of $50, as the lower limit of this level, is possible. If it recovers with a bullish trend from the support level, buy setups should be sought by traders.
Please enter CoinGecko Free Api Key to get this plugin works.
With regard to the price moving to the upper limit, long trades can be initiated as such. According to the chart, there is a sell signal indicated by the MACD line and the signal line being below zero. Furthermore, Litecoin’s price is under the 12-day EMA and 26-day EMA, suggesting a bearish trend. Still, the price has a sideways trend as indicated by the Relative Strength Index period 14 being level 40.

LTC/USD Short-term: Bearish
According to the 1-hour chart, LTC’s price stands bearish. Litecoin’s price is under the 12-day EMA and 26-day EMA, suggesting a bearish trend. There is a sell signal indicated by the MACD line and the signal line being below zero.
