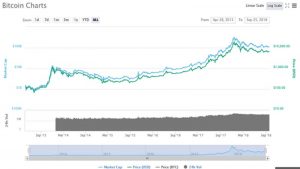
The 2018 Bitcoin (BTC) trend of parabolic increases could see the giant digital currency click a new all-time high (ATH) in the next three months and part of the first quarter of 2019. For the better part of 2018, BC has been swaying between $6000 and $7000 with its best third quarter value of $8400 set in July 2018.
BTC’s Logarithmic Price Growth
The only song that most BTC critics know is its volatility. They always point out the sharp declines that BTC experiences in most of their arguments. I totally accept their claims, but BTC critics miss the bigger picture of the behaviour of this currency over time.
Since its conception, BTC has seen several great price declines. Nevertheless, BTC has always finished each decline at a price zone remarkably better than its price at the start of previous price rally.
Thus, it is acceptable to say that BTC shows steady parabolic gains of a logarithmic property. From the chart below, BTC price seems to be in sharp decline since its mid-December 2018 ATH.

Nevertheless, the second chart below shows that BTC’s price has steadily increased on a yearly basis. No matter any price crash, BTC retains a steady variance when likened to its previous value.

The Warren Buffet Investment Portfolio Comparison
At the beginning of 2018, Clem Chambers of ADVFN compared BTC’s logarithmic growth with that of Warren Buffet’s Investment Portfolio. Chambers points out that the value of BTC gains by 26% every year. This compelled him to make a bold prediction that BTC could rise from $20,000 into the zones of Draper and McAfee who have predicted BTC to be valued from $250k to $1 million.
In line with history, during BTC’s initial bubble stage, it increased from $0.95 to $32 before experiencing a 90% decline that saw it being valued at $2. In 2013, the same trend was repeated where BTC rose from $100 to $1200 before facing a remarkable decline that saw it valued at around $200 to $300.


