
 Price Estimates")
Litecoin (LTC) was designed as money for the internet age, free from any form of censorship and open to all users. It embraces a secure, private, and borderless payment system that is completely user controlled.
However, the current market trends indicate that the seventh largest cryptocurrency is experiencing a steady slump in value. Litecoin is headed to the danger zone with a 0.48% drop and trading at $53.48 at the time of writing. The 24-hour volume of the cryptocurrency is at 300 million according to CoinMarketCap.
Table of Contents
Emerging trends
In order to understand how Litecoin (LTC) behaves of late, it is advisable to observe the cryptocurrency in short and long-term ranges. In a currency-trading atmosphere, whether universal or crypto, there is a huge difference between one hour and one day.
1-hour trading
The following graph illustrates the behavior of Litecoin in a 1-hour timeframe.
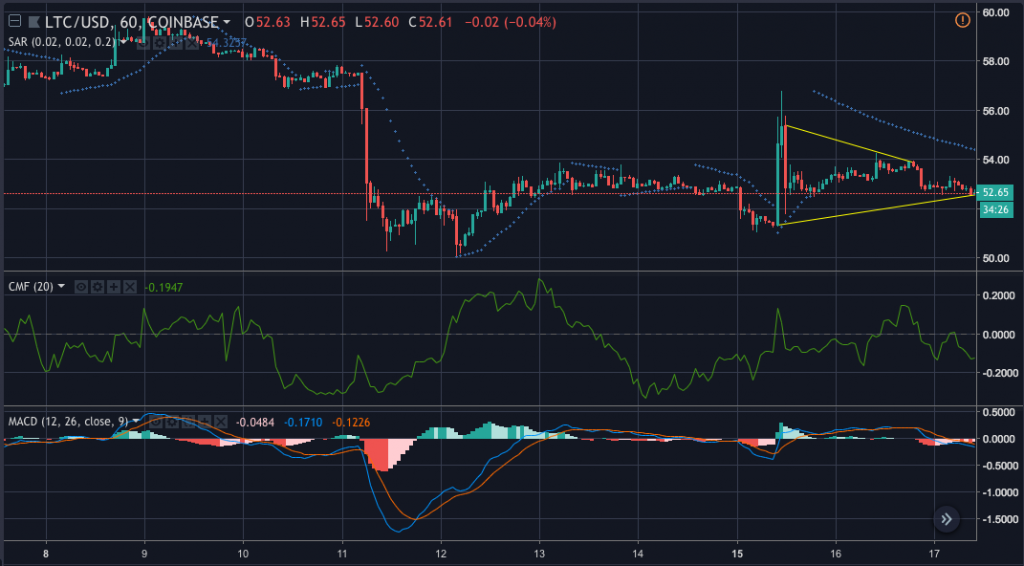
In a period of one hour, it’s evident that the trend lines move closer to each other, away from the point of intersection. It’s also evident that there is an allowance for a price breakout in the trend. The trend lines between $55.3 and $53.8 can show this. This indicates stability in the LTC market at this time.
All the same, the Parabolic SAR, which is the prediction indicator used here points to a depreciating market. On the graph, it’s possible see the dots floating over the price candles, which stifles an upward trend. Similarly, another price indicator, Chaikin Money Flow (CMF), points to a depreciating market, hovering below the zero line.
On the same note, MACD confirms the negative price prediction, indicating a bearish crossover with the signal.
1-day trading
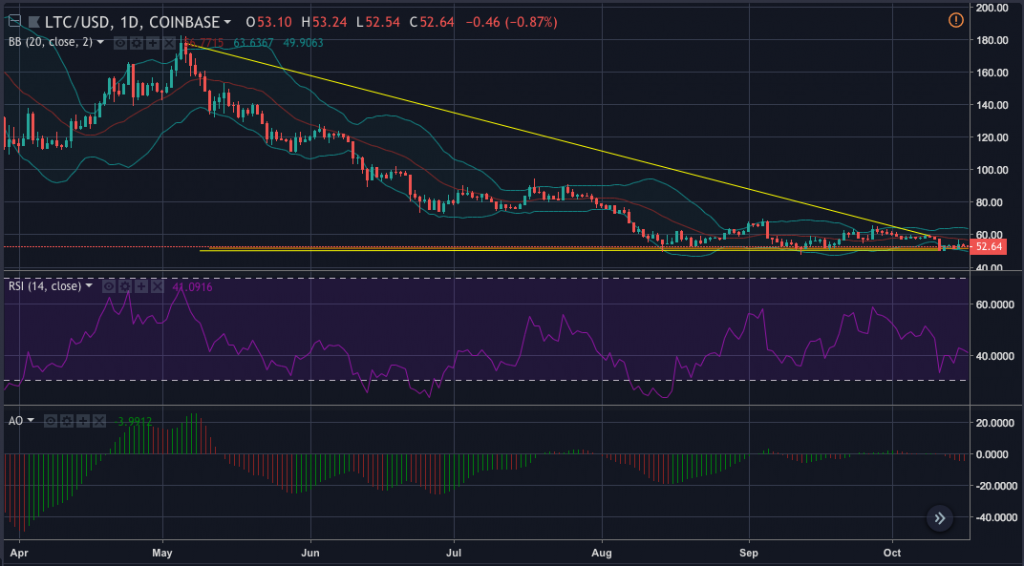
When it comes to 1-day trading, the digital currency still shows a downward trend, with its candlesticks breaking the first support at $51.6 and creating a second support at $50.5. Equally evident is the descending trend line from $178 to $59.3, nearly forming a downward triangle with the current support. This points to a breakout, which is likely to happen.
On the other hand, RSI shows a bearish trend on the LTC market, just all the indicators in the 1-hour trading. A similar price indicator, the Awesome Oscillator, shows a similar opinion. The graph shows it flashing red to indicate a bearish trend.
Earlier in September, Litecoin experienced a 5% drop as digital assets experienced cooling across the board. While the decentralized digital currency has maintained its position, the continuing downward trend is scaring many investors.
About Litecoin
According to Litecoin.org, “Litecoin is a peer-to-peer Internet currency that enables instant, near-zero cost payments to anyone in the world. Litecoin is an open source, global payment network that is fully decentralized without any central authorities. Mathematics secures the network and empowers individuals to control their own finances. Litecoin features faster transaction confirmation times and improved storage efficiency than the leading math-based currency. With substantial industry support, trade volume, and liquidity, Litecoin is a proven medium of commerce complementary to Bitcoin.”
Final words
This technical analysis concludes that all the above indicators depict a bearish trend for Litecoin. Going forward, this is bad news for the LTC market, as the prices are likely to run further downhill.
Images courtesy of Trading View and The Oofy Library
