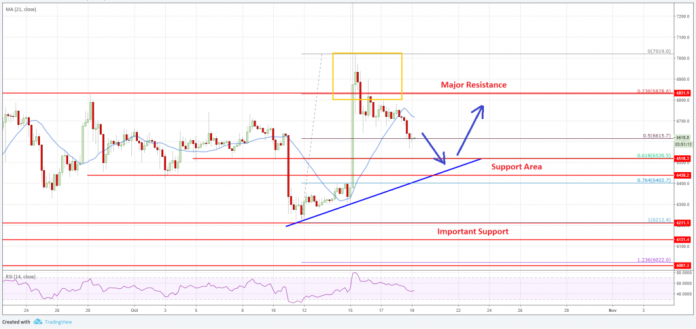
Bitcoin is still caught up in the most recent market dip that took away -30% of its value in the course of the last seven days.
BTC even went down to touch its new low for 2018, going below 5,000$ and currently being traded at the price of 4,539$ with the latest drop of barely -0.50% against the dollar.
As the crypto market is seen in what appears to be a rebound today as even Bitcoin Cash had made it back to the spot of the 4th largest crypto with 13% of gains in a day, there is a hope for BTC as well.
With the latest movement of 0.50% up in the last hour, here is how the previous momentum of BTC looked like on Bitcoin price chart for 2018.
Table of Contents
Bitcoin Price Chart 2018: BTC and the Promising Beginning of 2018
Bitcoin made it to the price of 20,000$ back at the beginning of December 2017 weeks before the mass rebound took place in January.
In the meanwhile, Bitcoin dropped from its peak price to the value of below 14,000$ in a matter of weeks, however, January brought some gains that further placed relief upon BTC investors.
January 2018 started out in a rather benevolent way for the overall crypto market as the majority of cryptos were jumping up to reach record prices.
Bitcoin, thanks to the positive momentum in the market, managed to bring its value up to over 17,000$ already in the first days of January, but it soon became evident that despite the belief that 2018 will be THE year for cryptoverse, 2018 was going to be rough.
In a matter of two days, BTC was already down to 15,000$ from the value of over 17,000$.
Bitcoin and the Frequent Cuts of 2018
Up from the point where BTC dropped to 15,000$ in only 48 hours, the top crypto just kept declining until it reached the price of 11,000$ in less than two weeks.
From 11,000$ Bitcoin dropped to 6,000$ in the course of no more than three weeks, entering February at its yearly low.
Even though 2018 started out with prominent gains in January and BTC started out at the price of 17,000$, it took only a month to see it down to 6,000$, at the same time making one of the most turbulent periods for BTC.
BTC could later on experience several reliefs in the second week of March where the crypto was able to climb to the value of 10,000$ and 11,000$, again gaining positive momentum.
Bitcoin (BTC) Price Today – BTC / USD
Please enter CoinGecko Free Api Key to get this plugin works.
Declines soon stroke back, arriving with more price fluctuations, showcasing a rather vulnerable and unstable market which greatly affected Bitcoin and its value.
It wasn’t only Bitcoin that was affected by the negative market trends – the entire cryptocurrency market lost almost -90% of its value.
Bitcoin was once again able to reach the price of 9,000$ and up at the beginning of May, but that was perhaps the last significant rise that BTC had until the end of June when it hit 8,000$.
From that point on, BTC was hovering between the value of 6,000$ and 7,000$ for weeks, only to decline to its latest low of around 4,500$ with November dips.


