

People are wondering whether or not there is another stock market crash around the corner. In this article we are going to analyze at the biggest crises that occur in the past to look for clues.
First of all, we are going to look at the six of the stock market setbacks around the world that occurred within the last 30 years to see what lessons they hold for investors today. The data was compiled by the fund manager, Liontrust.
Table of Contents
‘Program Trade’ Crash in 1987
It took 456 trading days to regain back to the pre-crash level. The crash occurred following the stock markets, which enjoyed a five-year bull run, on both sides of the Atlantic.
People who had never invested in shares before became involved. This euphoric trend was partly the result of the big privatizations of the Thatcher period that were priced to make an immediate profit possible. At the end, valuations have stretched more and more. And eventually Black Monday occurred. To some it was the result of the weakening global economic data, but losses intensified by the fact that computerized trading had become more widely available. In only a day, Wall Street fell by almost 23pc, whereas the FTSE 100 posted two successive daily falls of 10pc.
Asian Crisis in 1997
It took 46 trading days to regain back to the pre-crash level. In 1994, a financial crisis was sparked in Mexico, which was not able to afford to service its debts, due to the U.S.’ decision to raise interest rates. The same fate hit Thailand, Korea and the Philippines after a couple of years later. The results included downfall of their currencies and investors fleeing, as well as spreading fears of worldwide economic meltdown. It also affected the Western stock markets. They fell, but rebounded quickly after the Asian countries agreed to severe austerity programmes.
Russian Crisis in 1998
It took 44 trading days to regain back to the pre-crash level. About a year later, the Asian crisis finally fed through to commodity prices, but this time it hit Russia’s foreign exchange reserves. In the end, it devalued Russia’s currency and defaulted on its debt. This also triggered a bigger financial panic all around the world.
Tech Bubble in 2000
It took 1,015 trading days to regain back to the pre-crash level. With the arrival of the millennium, investors had been caught up in the trend of the technology. They were more than eager to purchase fast-growing firms with ambitious plans. At its height, it was a common thing for a share to double its value on the first day of trading, even for the ones that did not seem to have a sustainable business model. But the bubble couldn’t last for long and it eventually popped. These falls were compounded by the panic induced by the 9/11 attacks on New York and Washington.
Global Financial Crisis in 2008
It took 230 trading days to regain back to the pre-crash level. It all started with Lehman Brothers, the American investment bank, filing for bankruptcy. This led the world’s financial markets, which were already in turmoil, entering a full-blown crisis. Between Lehmans’ collapse and March 2009 the FTSE fell by another 1500 points to just above 3500, which marked the trough. It took almost two years for the index to recover itself.
Greek Debt Crisis in 2011
It took 116 trading days to regain back to the pre-crash level. In 2011, the first stages of the long-running debt crisis in Greece had begun. A great default on Greece’s debt initiated panic, but markets recovered when the European institutions and the International Monetary Fund agreed to grant Greece a bail-out.
The information on the recovery times demonstrates that only three of these crises can be considered as genuine turning points in history: Black Monday in 1987, the bursting of the technology bubble burst in 2000 and the great financial crisis of 2008. The others including the Asian crisis in 1997 and the European debt crisis in 2011, were more in the nature of corrections, since the FTSE 100 regained back its losses rather quickly.
THE WORST STOCK MARKET CRASHES IN THE U.S. HISTORY
Below are the five of the worst stock market collapses in the U.S. history based on daily percentage losses:
October 19, 1987
Percentage change was: -22.61 percent
“Black Monday” is mentioned again as one of the worst of the crashes once again in this list. This devastating crash began in Hong Kong, spread to Europe and then hit the U.S. deeply
October 28, 1929
Percentage change was: -12.82 percent
The Wall Street Crash of 1929, also known as the “Great Crash” or “the Stock Market Crash of 1929” began on October 24 and signaled the beginning of the 12-year Great Depression. The fourth and worst day of the crash, aka Black Monday, saw a drop of as low as 12.82%.
December 18, 1899
Percentage change was: -11.99 percent
During the Panic of 1896, the United States experienced a strong economic depression caused by a drop in deflation and silver reserves.
October 29, 1929
Percentage change was: -11.73
Black Tuesday was the fifth day of the the Wall Street Crash of 1929, also known as the Great Crash or the Stock Market Crash of 1929 that started on October 24 and signaled the beginning of the 12-year Great Depression. The drop was slightly better than the day before but the second worst of the crisis.
November 6, 1929
Percentage change was: -9.92
Just a week following the height of the 1929 Stock Market Crash, investors saw another dip.
The Dow Jones Industrial Average
The Dow Jones Industrial Average is one of the oldest and most popular indexes in the financial industry. It has, by its nature as a benchmark for the largest stock market in the world, become an important barometer of global confidence over the years.
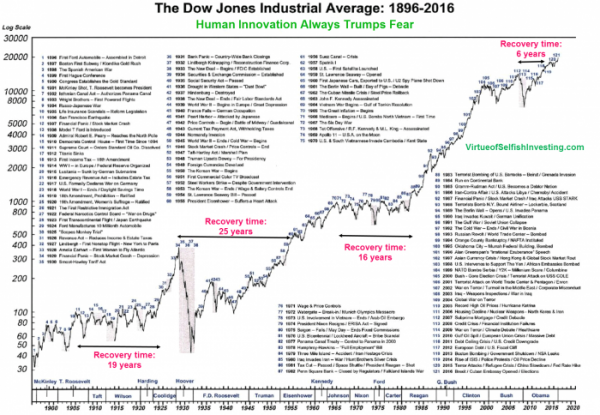
Managing director of MoKa Investors, Chris Kacher published a graph of the Dow Jones’ performance since 1896 that demonstrates how the index’s peaks and troughs corresponds to the U.S. economy’s triumphs and tribulations. In addition, the graph also shows how the Dow Jones has become a chronicle of investors’ responses to important global events.
According to Kacher, the chart at its simplest form proves once again that the stock market always rises over the long term because “intelligence, creativity, and innovation always trump fear.”
However, it also highlights to the basic formula that market participants need to stay nimble during times of uncertainty to maximize their returns. Kacher added that the investors should stay fluid to changing market conditions and not become wedded to their stocks. He said: “There is no get-rich-quick scheme. There is no such thing as a black box where you press a button and let it run indefinitely. Investing is more challenging than brain surgery.”
According to MeasuringWorth, a website run by academics Lawrence Officer and Samuel Williamson, the Dow Jones, which initially began with 12 components, has risen more than 50,000% over its lifetime. During this period, the U.S.’s nominal gross domestic product has increased by 118,583%.
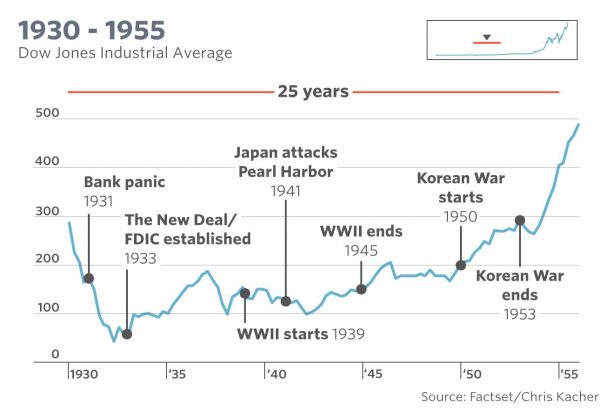
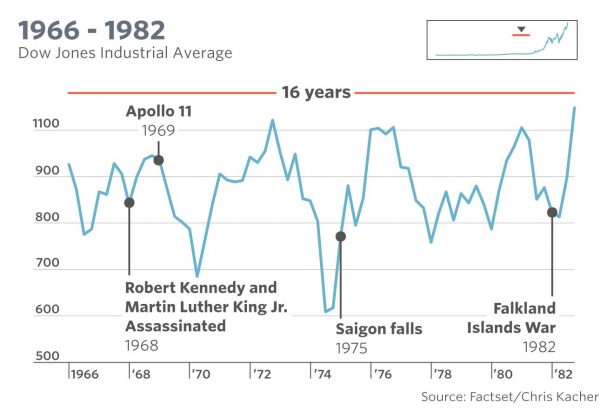
There were times when the Dow Jones upside trajectory was also bumpy. In between its bursts of energy that eventually took the blue-chip index beyond the 20,000 mark in 2017 were long periods of misery when the market remained in a downward spiral or moved sideways. It took about 25 years for the stock market to recover from the crash in 1929 and 16 years for stocks to bounce back from the combined effect of the Vietnam War, the resignation of President Richard Nixon and the 1973 oil shock.
According to Kacher, the current market is a prime example of which investors need to control and distance themselves from their emotions and remain fleet on their feet. In 2017, He said: “We are at a minor tipping point and we are not sure where the market is headed…These are unprecedented times. Global debt of this magnitude has historically has a calamitous ending.” It is important for investors to be prepared to adjust their strategies to adapt to the changing environment. “Be flexible,” Kacher said. As his 120-year chart clearly shows, one way or another, the market always recovers. Sometimes, it takes a little longer than the other times, that’s all.
Lessons To Be Taken
These crashes did happen but what were the warning signs that these great crashes were approaching? John Husselbee, who runs “multi-manager” funds for Liontrust, and also a fund manager for 30 years, explains four key indicators to watch out for.
“What set the great crashes apart from my perspective were changes – before the market dropped – in what I deem the key indicators of fear: the ‘Vix’ index, widely known as the fear index; the gold price; the US dollar; and the yield on US government debt…In 1987 and 2008 the first three rose, while yields on US government bonds shrank [meaning that their prices rose] as investors fled to safety. Stock markets are driven by fear and greed, and each of these early warning indicators was a reflection of the fear at the time.”
Other investors emphasize the significance of the valuation of shares relative to the profits being generated. Russ Mould of the fund shop AJ Bell commented: “Real market accidents tend to happen after a long run of good performance and the appearance of commentary that tries to argue ‘it is different this time because of…Other warning signs are when corporate earnings start to disappoint or the economy tips into recession.”
Perhaps the most important lesson to take from the past stock market crashes is that even the heavy falls ended up being little more than a stumble in the market’s long-term rise.
This is significant especially for the ones who hold their nerve, invest steadily and regularly, because they will be able to ride out the storms, particularly when they consider the added power of reinvesting dividends.
