

Highlights
Ethereum classic is getting stronger over the support level of $10.80 against USD.
According to the hourly ETC/USD chart (source: Kraken), with $11.35 resistance, there occurs a major bearish trend formation.
This trend line is probably going to break for testing the resistances of $11.80 and $12.00 in the short-haul.
Please enter CoinGecko Free Api Key to get this plugin works.
ETC/USD Medium-term: Ranging
Supply: $11.60, $11.80, $12.00
Demand: $11.00, $10.80, $10.60
ETC/USD Short-term: Bearish
Hourly MACD – The MACD for ETC/USD gets stronger in the bullish area.
Hourly RSI – The RSI for ETC/USD is now over the level of 55.
Major Support– $10.80
Major Resistance – $11.35
Chart
Yesterday, ETC/USD experienced more substantial dips in terms of the market price movement. The cryptocurrency has been more dropping than trending upwards while trading against the market value of USD.
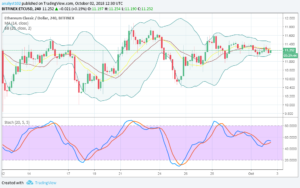
ETC/USD market experienced various remarkable bearish moves. $11.10 demand level was forced by the crypto in face of the lower Bollinger Band, and the market saw a strong and sudden jump for heading to northbound past both the 50-day SMA and the middle Bollinger Band to reach the upper Bollinger Band later.
As for now, ETC/USD market price line seems still to incorporate the price ranging movement. The range-bound zones have been thoroughly defined between $11.50 and $11.00. It has been traded between the lower and middle Bollinger Bands with 50-day SMA. The Stochastic Oscillators range between 60 and 40. However, there is a need for exercising caution in new trades as they point a bit down.
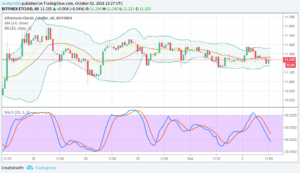
The upper Bollinger Band has employed a formation of Japanese candlesticks confluence, which has provided in turn the USD with advantages over crypto. The price has been ranging between the middle and lower Bollinger Bands. The Stochastic Oscillators have slightly past range 40 to point down. The level of $11.10 may be up for testing for another major entry into an upward trending market.
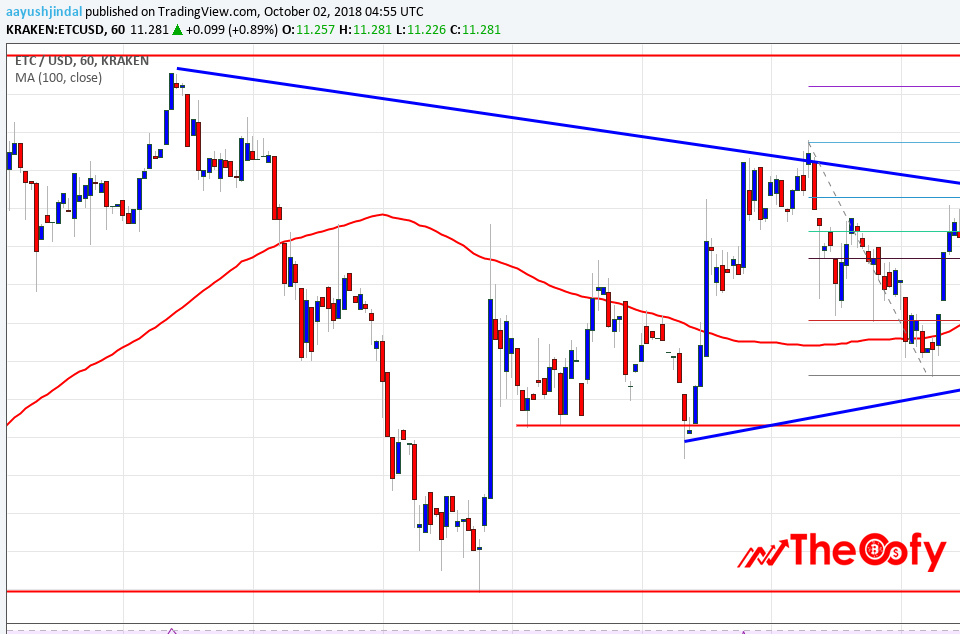
ETC, which has seen $10.40, is now with an upward trend against USD. The ETC/USD was hosted above the $10.80 support zone and established an intermediate dip at $10.78. Then, it saw the resistance levels of $11.00 and $11.20. On the other hand, the price couldn’t clear the resistance at $11.55 and dropped to the level of $11.00. Buyers came in around $11.00 and forced the price over 50% Fib retracement level of the recent dropping from $11.57 to $10.96.
According to the chart, ETC is up for its next move over $11.35. On the other hand, in case of a potential downward break, the support levels of $11.00 and $10.80 will probably prevent any loss.
After all, the price is strongly trying a level over $10.40 and the 100-hour simple moving average. Also a major bearish trend was formed at $11.35 resistance according to the hourly ETC/USD chart. Following the trend line, 61.8% Fib retracement level of the recent dropping from $11.57 to $10.96 is at $11.34. Thus, for a momentum in the short-haul, buyers look for clearing the resistance at $11.35. In this respect, the price is probably going to break $11.57. Then, $11.80 and $12.00 could be sought by buyers.
