

Table of Contents
Trade boots continue to annoy. According to the Wall Street Journal, trade boots manipulate the prices of Bitcoin – Ethereum and Ripple.
Trade Boats Bitcoin – Manipulates Ethereum and Ripple Prices!
For the last 24 hours the image in the markets is not nice. Everybody was excited about the coming of Ripple and Stellar and the way the bull race was observed.
This decline led to a 1% decline in the volume of the crypto money market. As of now, the entire market volume has fallen to $ 220 billion.

According to a study by the Wall Street Journal, trading boots are manipulating markets.
According to the report, unscrupulous investors do not hesitate to use this opportunity to the end. Some trade boots are very successful in using the market misleading strategy.
The method they use is quite simple: The user enters fake orders on an entity. Trade boots are inflating this counterfeit order or selling direction. You open the screen and you are looking at the volume is expanding or decreasing. In a mood of panic, they leave you standing upside down, grabbing what you have, or selling what they have.
According to federal law in 2010, it was forbidden to use trade boots on traditional exchanges across the United States. However, the crypto eco-system, which is not yet regulated, has no such prohibition. There are even some trading platforms on the platforms of some exchanges like Binance! Unsophisticated manipulators do not hesitate to use this possibility to the end.
Bitcoin, Ethereum and Ripple Price Analysis for October
Bitcoin started the week at $ 6700 and fluctuated at $ 500 a week between $ 6330 and $ 6830 a week. The week ended at the $ 6600 level, losing 1.5%. Let’s continue by examining the technical events during the week.
We see that Bitcoin starts with two red bars next week. This downtrend moved the price from $ 6700 to $ 6330. At this stage, the FIBO2 level of 0.236 ($ 6484) was broken down. On Wednesday, this level was re-tested in the bar, but the closing was again below. On Thursday, there is an uptrend with an outbound transaction. This move continued on Friday and raised the price to $ 6830. I have already stated that the C ($ 6800) level is a major resistance zone. Again in the same way as the resistance worked and the price was steel back. Here, the price touched the L1 trend, which I mentioned in the second chart, shows that the price movement is trapped between L0-L1 trends. We can say that the weekend movement is supported by FIBO2 0.236 ($ 6484). At the volume and RSI side, the price has a stable appearance parallel to the band movement. As a result of these developments, we can make our main evaluation.
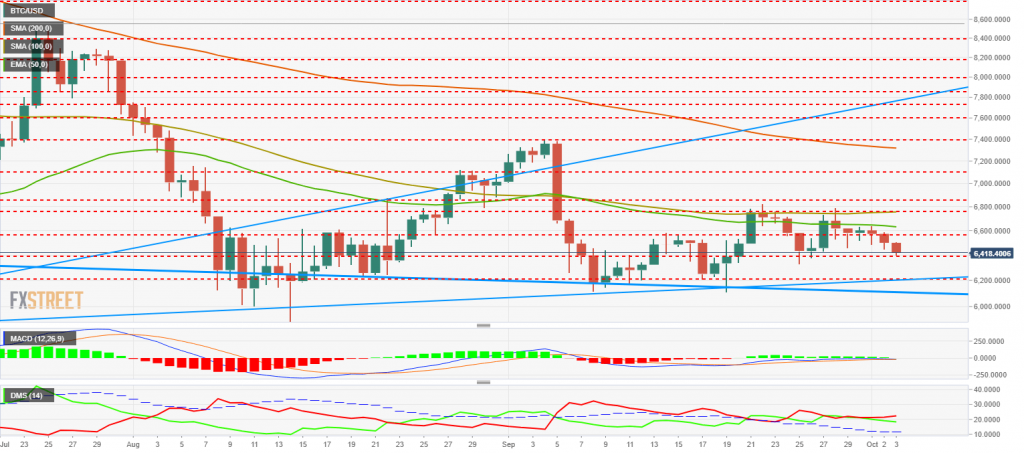
Bitcoin added a 7-day bar to $ 6000- $ 7,000 this week and 81 days of the last 112 days remained in this band. In this context, when we look at the first chart below the resistance of C ($ 6800), the number of bars in the $ 6000- $ 7,000 band will increase. Of course, this should not be considered as negative. In the event that the price breaks C ($ 6800) first and then the A trend upwards, it will be able to support $ 6000- $ 5000. However, the breakdowns I have stated must necessarily be broken by the volume support. On the other hand, when we look at the second chart, we see that the price is squeezed between L0-L1 trends within two months. As a result of this jamming, a break will be inevitable. It is not possible to say the breakdown date clearly. However, the intersection of trends coincides with October 20-21. It is useful to follow the short term support and resistances in the graph according to the break direction. Here, another thing that confuses my mind is the possibility that the market maker can make a bear or bull trap. For these situations, it is necessary to follow strictly and to be cool.
The price of the Ripple XRP is $ 0.48, a very important support level. The Ripple XRP has lingered too much at the levels of $ 0.54 and $ 0.52 a declining trend band for itself over the past 24 hours. This led to a downtrend and the price of $ 0.48 support led to the point Note: As the modeling was done at 12 pm, the decrease in the graph was not reflected.
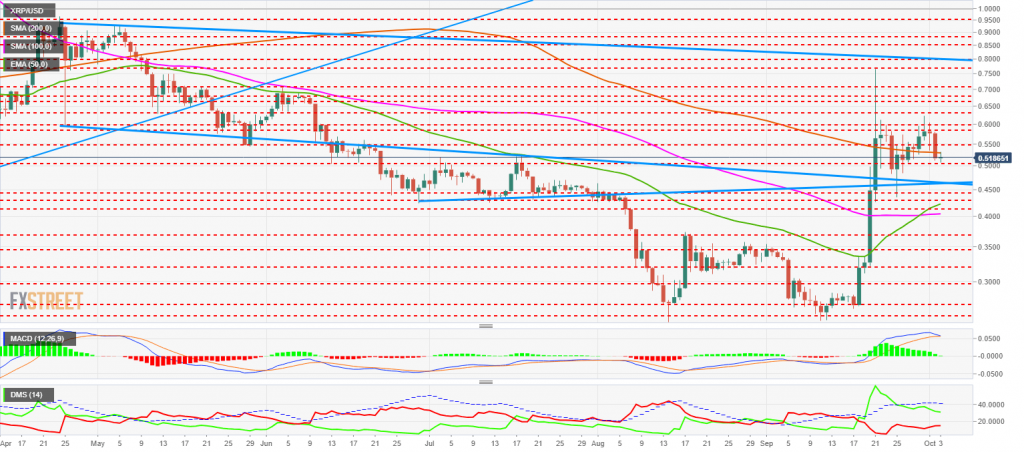
When we look at the EMA (exponential moving average), we see that the point of resistance for the price is 0.51 dollars. He needs to break this resistance before he rises. Klinger Volume Oscillator (one of the indicators of power), this week, had a downward trend. However, it will soon form another exponential trend. When we look at the stochastic RSI indicator, we see a strong decline in the over-sold territory. This means that prices will rise. This indicator showed the opposite before experiencing a downward refraction.
Ethereum (ETH) prices continue in the range of medium-term outlook. As the bears pressure is so strong, there has been a new decline in demand in the demand zone below US $ 224.00. Ethereum (ETH) prices are just under 50 EMAs, but as a depleted syndrome, a click continues to be above that. At the end of the session yesterday, Ethereum (ETH) prices rose up to $ 232.35 thanks to bulls.
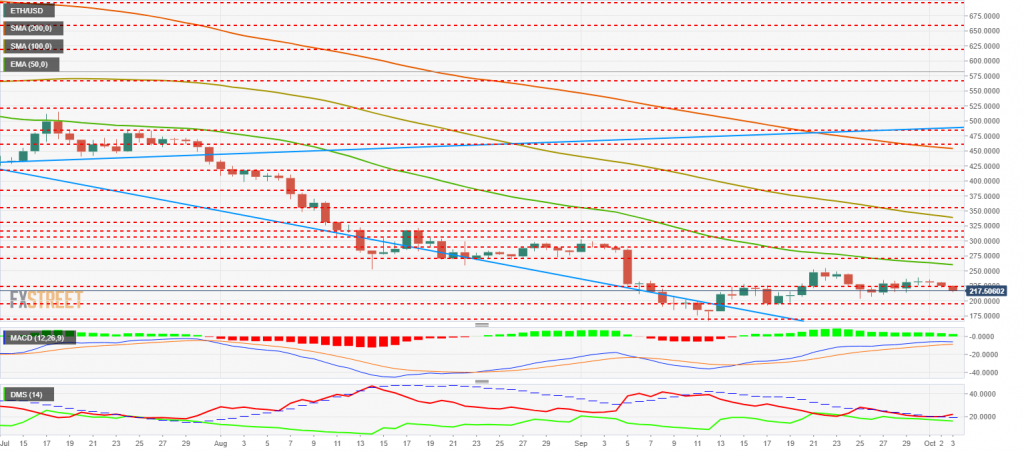
Ethereum prices rose to $ 231.49 four hours after the opening, while Ethereum prices increased, while the demand margin fell to $ 228.50. Ethereum (ETH) prices are in the range of $ 239.89 in the consolidation and top supply area and $ 217.08 in the lower demand area of the range. A slight rupture may occur in the upper supply region or a slight rupture in the lower area. In this context, to be able to place the threshold above a certain level, as stated in the title of the manuscript: Let patience be your lighthouse.
ETH continues to consolidate its short-term outlook. It fell due to a downward trend of $ 224.00 in the demand zone. The bulls began to lose momentum in the bears as long-tailed candle bulls pulled their bulls back into the market. As a result of the upward pressure in December, before the end of the trading session yesterday, Ethereum drew a remarkable uptrend of $ 232.35.
The folding in the sockets is at 58% and Ethereum shows the price range as a downward movement. This indicates a downward position. Ethereum (ETH) prices are in the range of $ 238.00 at the upper supply margins and $ 223.58 at the lower demand margin of the range. My personal wings are; Before investors take a position; it is in the interests to wait for a break, a failure and then take action.
